Entering data into a spreadsheet is one of the more mundane aspects of my job, but it’s also a critical part of what I do. I’m able to take lots of data about our company and use math to figure out how we can better serve homeschool families. That’s the part that excites me.
Spreadsheets are used in just about all academic and business environments. Learning how to use them at home can give your student a big advantage in college and in the workforce.
Here’s a basic and enjoyable activity from our Algebra 2 textbook to get your child started with spreadsheets and show how math concepts relate to everyday work. The user interface can vary depending on which spreadsheet software you’re using, but just about any should work for this activity. Here are some popular options:
• Google Sheets™ – You can use this web-based spreadsheet program for free, but you have to have a Google account. It can be used on just about any platform.
• Microsoft Excel – This is perhaps the most robust and widely used spreadsheet program. It’s paid software that you install on your Windows, macOS, iOS, or Android device.
• LibreOffice® Calc – As open-source software, this can be downloaded for free and installed on just about any desktop operating system. The interface is a bit dated compared to the other two options.
Activity: Daily High Temperature
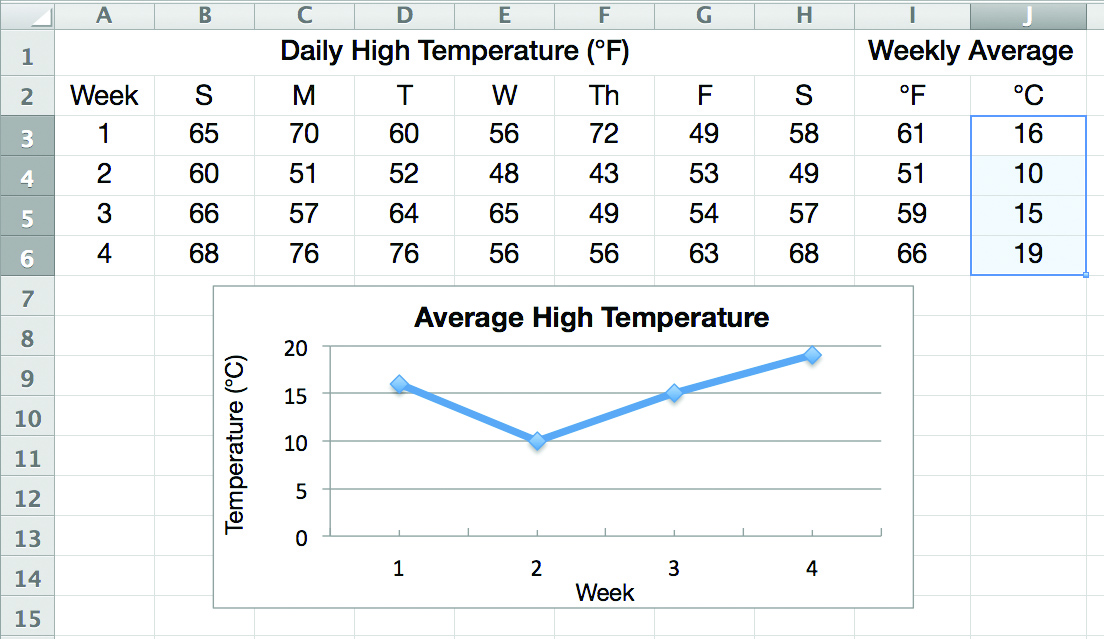
A scientist can use a spreadsheet to track a city’s daily high temperature and to determine the weekly average temperature in both Fahrenheit and Celsius. Make a spreadsheet to record a particular location’s high temperatures daily for several weeks and construct a graph illustrating the data. Weather Underground has a great weather history tool that you can use for this.
After entering the numbers for the first two weeks in column A, highlight the cells that establish a pattern (cells A3 and A4). Then use the fill handle (the small square in the lower right-hand corner of the highlighted area) to expand the box down the column to row 6.

Now record the data for each day. Also enter the following formulas to calculate the average high temperature for the week in Fahrenheit and convert this average to degrees Celsius.
In column I row 3 (cell I3), enter =(B3+C3+D3+E3+F3+G3+H3)/7 to find the average.
In column J row 3 (cell J3), enter =5/9*(I3-32) to convert to Celsius.
Most spreadsheets include a function (for adding a series of numbers and finding their average) that can be used to simplify the first formula to something like this: =(AVERAGE(B3:H3))

These formulas can be copied into the cells for the remaining weeks by dragging the fill handle down. Notice how the cell references in the formulas are adjusted relative to each cell’s position in the spreadsheet when the formula is replicated in this manner. Most spreadsheets also allow you to quickly generate graphs from the numerical data.

Once the activity is completed, have your student think about how math was at work behind the scenes. Ask questions like these:
- What does the data show?
- What did the formulas help you accomplish?
- Was using the spreadsheet easier than doing the work manually?
- Can you think of any other industries or tasks where a spreadsheet could be useful?
The goal of this activity is not to produce a nice graph at the end, but to gain an understanding of exactly how a spreadsheet works and how it can organize data and solve real-world problems using math.
If your student enjoys this activity, consider using one of the similar activities in Algebra 2 to improve your student’s spreadsheet skills.
Microsoft, Encarta, MSN, and Windows are either registered trademarks or trademarks of Microsoft Corporation in the United States and/or other countries.
Leave a Reply